RESEARCH
DISCOVERY
A Blog Devoted to UD Innovation, Excellence & Scholarship
COVID-19
Model Town Shows Real-Life COVID Spread
At the height of the COVID-19 pandemic, for a year, Richard Suminski and Gregory Dominick, both associate professors in the Department of Behavioral Health and Nutrition in the University of Delaware’s College of Health Sciences, spent countless hours monitoring human behavior.
Using drones and video glasses, they collected video and data on mask-wearing and social distancing to determine how these behaviors impact transmission of the COVID-19 virus. They found crosswalks were COVID “hot spots.”
“They’re not six feet wide, so when people bunched up at a crosswalk, they’re all getting real close to each other — so they’re exposing each other, increasing the risk. So, there’s these places that exist in the environment that might influence transmission,” said Suminski.
They teamed up with Norman Wagner, professor in UD’s College of Engineering, to analyze the data, using artificial intelligence algorithms, and turned it into a web-based educational model to be used in high schools that they hope will illustrate virus spread and further inform policy changes.
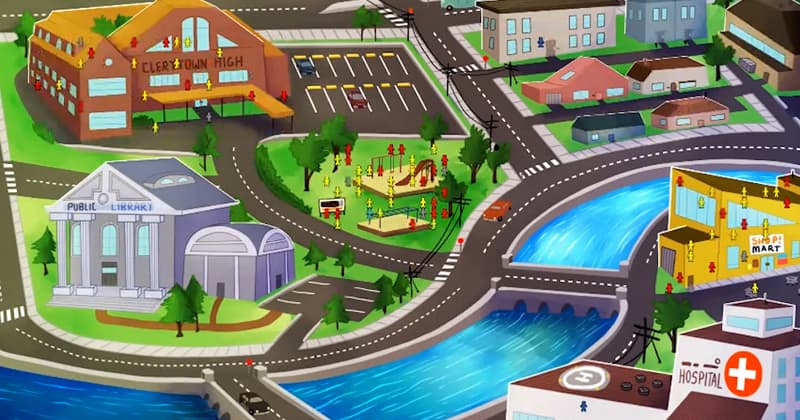
Their tiny town is called Clerytown, a nod to UD graphics design graduate Charlie Clery who designed the model to be kid-friendly. In Clerytown, you’ll find a library, a grocery store, and a hospital, and depending on the parameters you set regarding vaccination rates and mask compliance, at times, shocking rates of community spread of COVID-19.
“It shows people running around the town, and you can change the parameters, like you can say ‘everyone’s vaccinated,’ and then you see what happens to COVID rates — or whatever virus you’re looking at — and so people change colors as they get sick,” said Suminski.
The little dots represent people, and the data collected by Suminski and Dominick as well as other information, are used to guide their behaviors and outcomes.
Red is the color that indicates a person in the town is infected with COVID-19. The model has video game vibes. The more red dots you see running rampant around town, the more the virus is spreading within the community. A map to the right of the model town shows a red line indicating virus spread creeping upward.
“For example, you’re at a high school, and you can see what would happen if people go about their daily business,” said Suminski, who is also the director of the Center for Innovative Health Research at UD. “Let’s say they are not mask-compliant at all…and then you can look and see what happens to the infection rate, hospitalizations, death rates, and so forth.”
Users can change the settings in the model to reflect varying outcomes.
“What if we have more people wearing masks? What if we have more people vaccinated? What’s going to happen over the course of 20 to 30 days?” said Wagner, who is the Unidel Robert L. Pigford Chair in Chemical and Biomolecular Engineering at UD. “It also shows how quickly things get out of control. If you don’t take action, and you start to see some cases, and if you don’t start quarantining or asking people to stay at home, then things can really get out of control, and everyone gets sick. Hopefully, it’ll help teach people — OK, you don’t wear a mask, this is what’s going to happen.”
Other parameters can be changed on the model too. For example, you’ll see the infection rate skyrocket when persons known to be infected with COVID-19 don’t quarantine.
“They use social forces models and other epidemiological tools to come up with what would happen in real life,” Suminski said.
Even when parameters were set to show a high vaccination rate, virus spread was still strong — a reflection of the delta and omicron variants surging in communities.
Their research, known as Project Darien, is funded through the COVID-specific RAPID Response Research Program via the National Science Foundation.


